Performance
The November 2 benchmark used ViroSync 1.0.2 at commit 84eb6bb with resource
bundle v1.2.0, the bundle that public builds install. ViroSync ran with one worker
and 16 threads per input and no optional analyses. Comparator outputs come from
earlier runs and were not repeated. All figures below describe that benchmark; the
paired repeat-annotation regression is
reported separately. Select a figure to open the full-size image.
Synthetic boundary recovery
The synthetic set contains 60 loci and 3,365.2 kb of inserted sequence. Mean best-call boundary recall was 0.775 for ViroSync, 0.596 for ViralRecall v3.1.0, 0.307 for ViralRecall v2 and 0.056 for DetectEVE v1.4.0. EEfinder v1.1.1 has no pooled mean, because only 58 of its 60 inputs have usable output. ViroSync credited 57 of the 60 loci with 77 calls, of which 18 were redundant and 2 spurious.
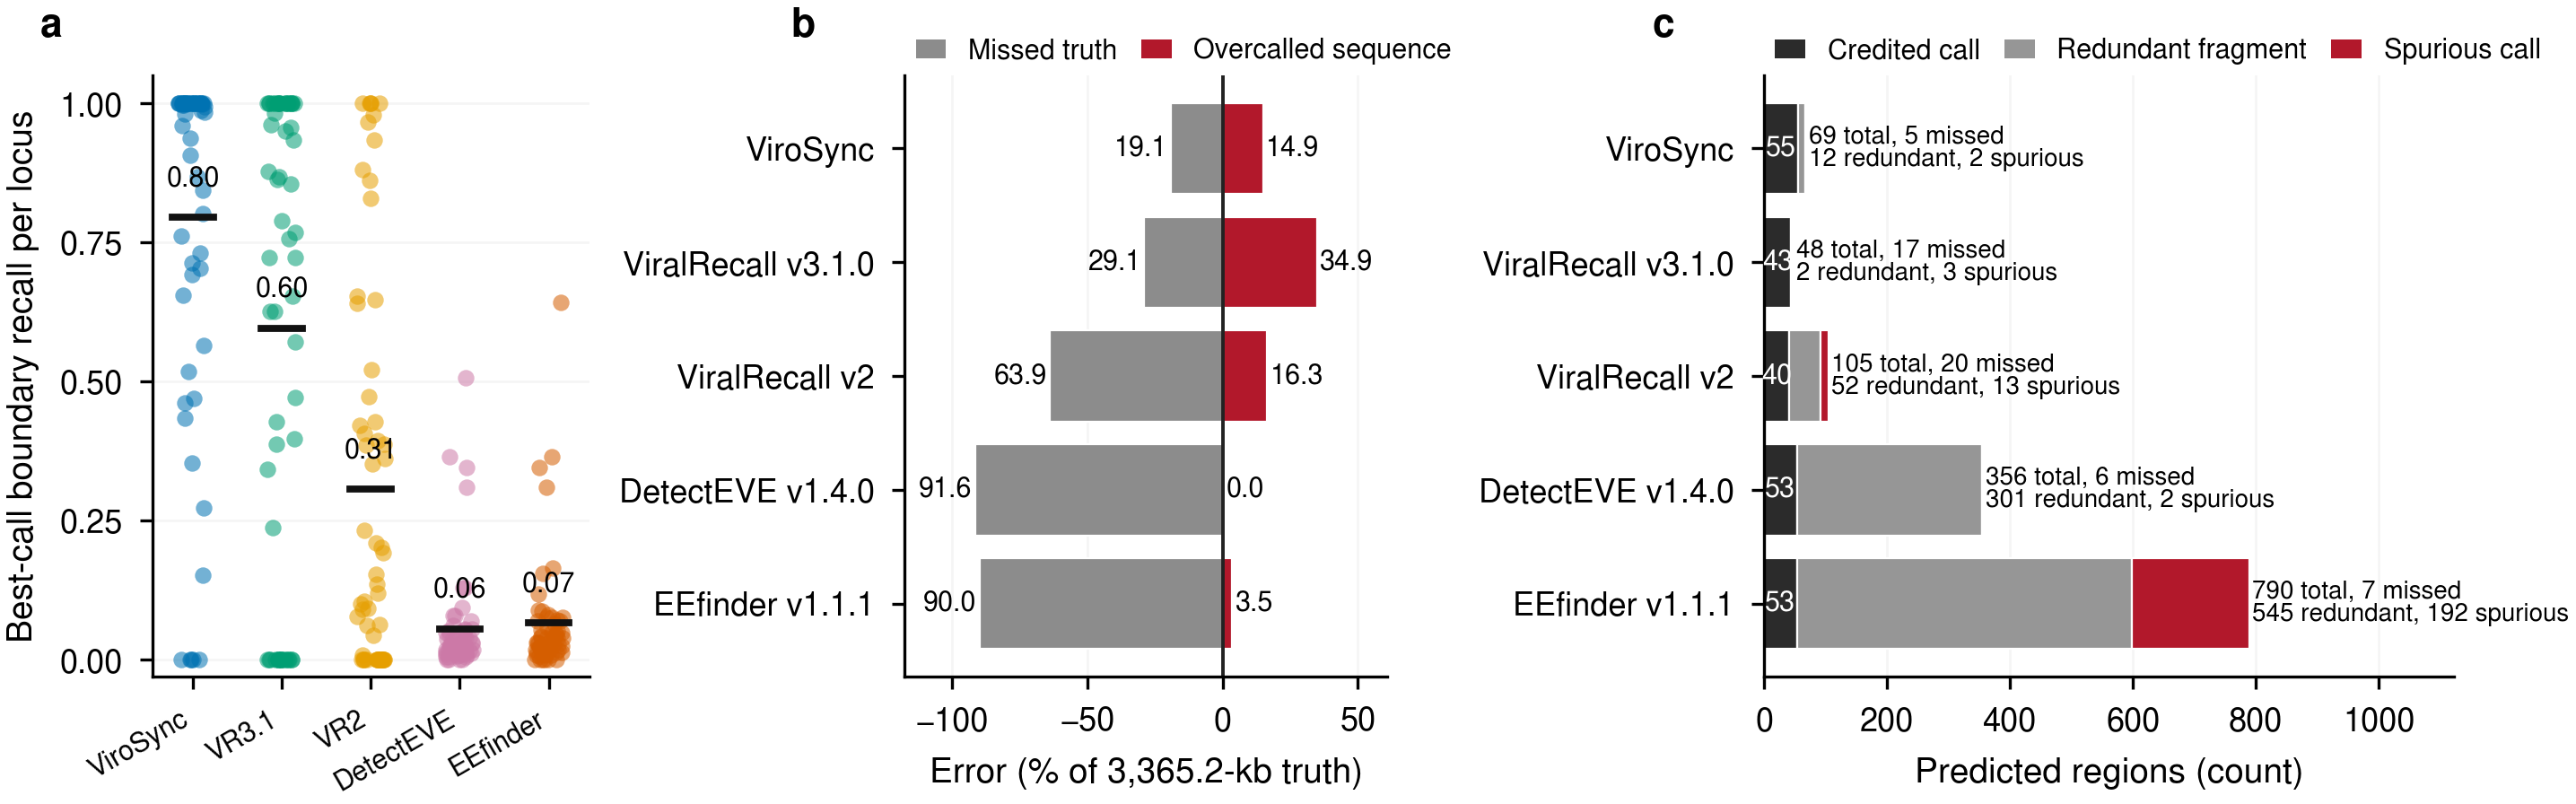
Boundary recovery and call burden across 60 synthetic loci. Panel a credits the call with the highest Jaccard index at each locus. Panel b compares missed and outside-truth sequence. Panel c partitions calls at a 500 bp one-to-one threshold. The test excludes 30 prior-discovery loci whose source elements ViroSync found before this comparison. Region detection has no true negative, so the plot does not report specificity or accuracy.
Published GEVE coverage
ViroSync's HIGH- and MEDIUM-confidence calls covered less of all three published giant endogenous viral elements (GEVEs) than the calls of ViralRecall v3.1.0. Adding LOW-confidence calls puts ViroSync ahead of ViralRecall v3.1.0 on the R. irregularis GEVE only. ViralRecall v2 covered the most of that element.
Coverage is the percentage of each published element overlapped by calls, so it does not measure precision or validate a call. Comparator columns use all calls. The T. socialis and R. irregularis elements were delimited with ViralRecall, so their coverage partly measures agreement with that tool.
| Published element | Size | ViroSync HIGH and MEDIUM | ViroSync all tiers | ViralRecall v3.1.0 | ViralRecall v2 | DetectEVE | EEfinder |
|---|---|---|---|---|---|---|---|
| T. socialis GEVEs | 3.21 Mb | 52.0% | 71.3% | 90.3% | 85.6% | 10.0% | 13.8% |
| R. irregularis GEVE | 1.55 Mb | 24.8% | 39.6% | 36.5% | 70.8% | 4.4% | 3.0% |
| C. reinhardtii GEVE | 617 kb | 57.1% | 57.1% | 84.2% | 75.6% | 10.2% | 5.0% |
Runtime and peak memory
Mean wall time across 30 SynEVEs-2 inputs was 137.0 seconds for ViroSync and 18.9 seconds for ViralRecall v3.1.0. Across five real-genome inputs, the means were 689.6 and 2,039.6 seconds. Mean peak memory on the real genomes was 6.0 GB for ViroSync and 2.1 GB for ViralRecall v3.1.0. Each run had 16 allocated CPUs on the same cluster, but jobs ran on different nodes and dates, so these values do not give a general speed ranking.
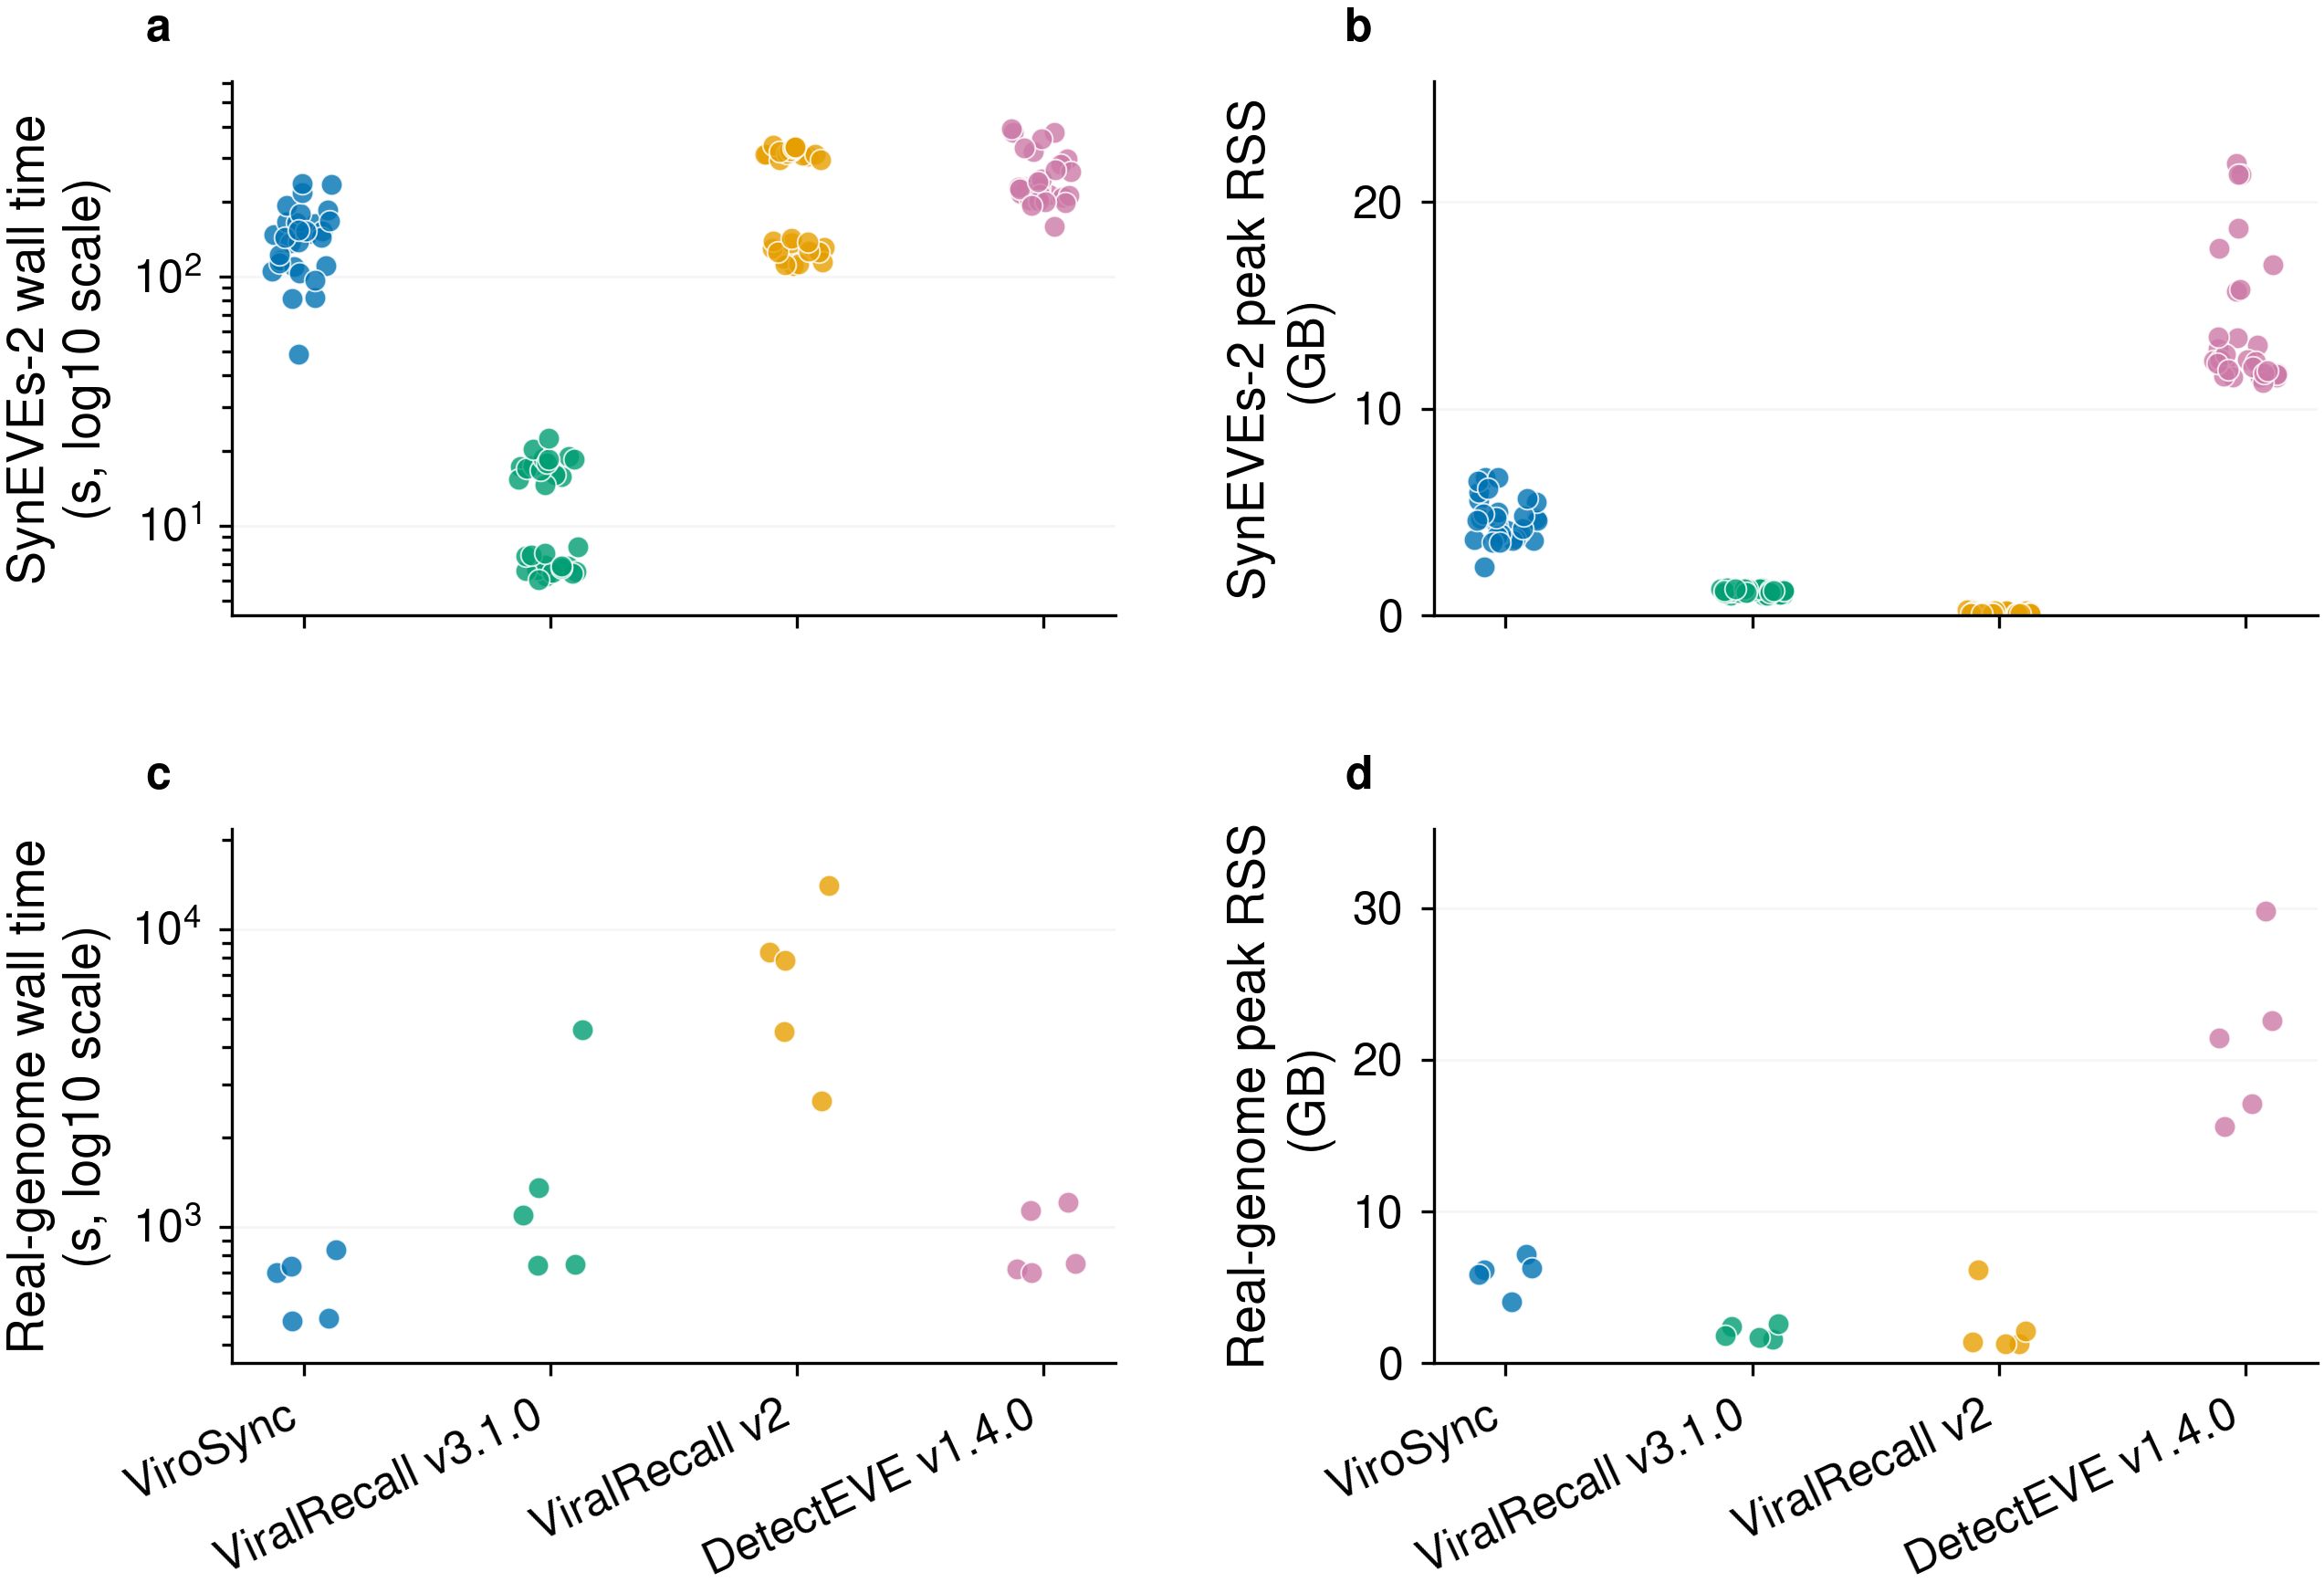
Per-input wall time and peak resident memory for 30 SynEVEs-2 inputs and five real-genome inputs, each with 16 allocated CPUs. Wall time includes contention and database caching. Peak RSS is shown in decimal GB for the largest single process, not the process tree. EEfinder is absent because its outputs are retained from a campaign with different load, and ViralRecall v2 shows the two real genomes with comparable measurements.
Real-genome output
ViroSync accepted 609 regions across the five real genomes: 66 HIGH, 258 MEDIUM and 285 LOW. These inputs have no complete region-level truth set. The figure describes output burden and gene content, not detection accuracy.
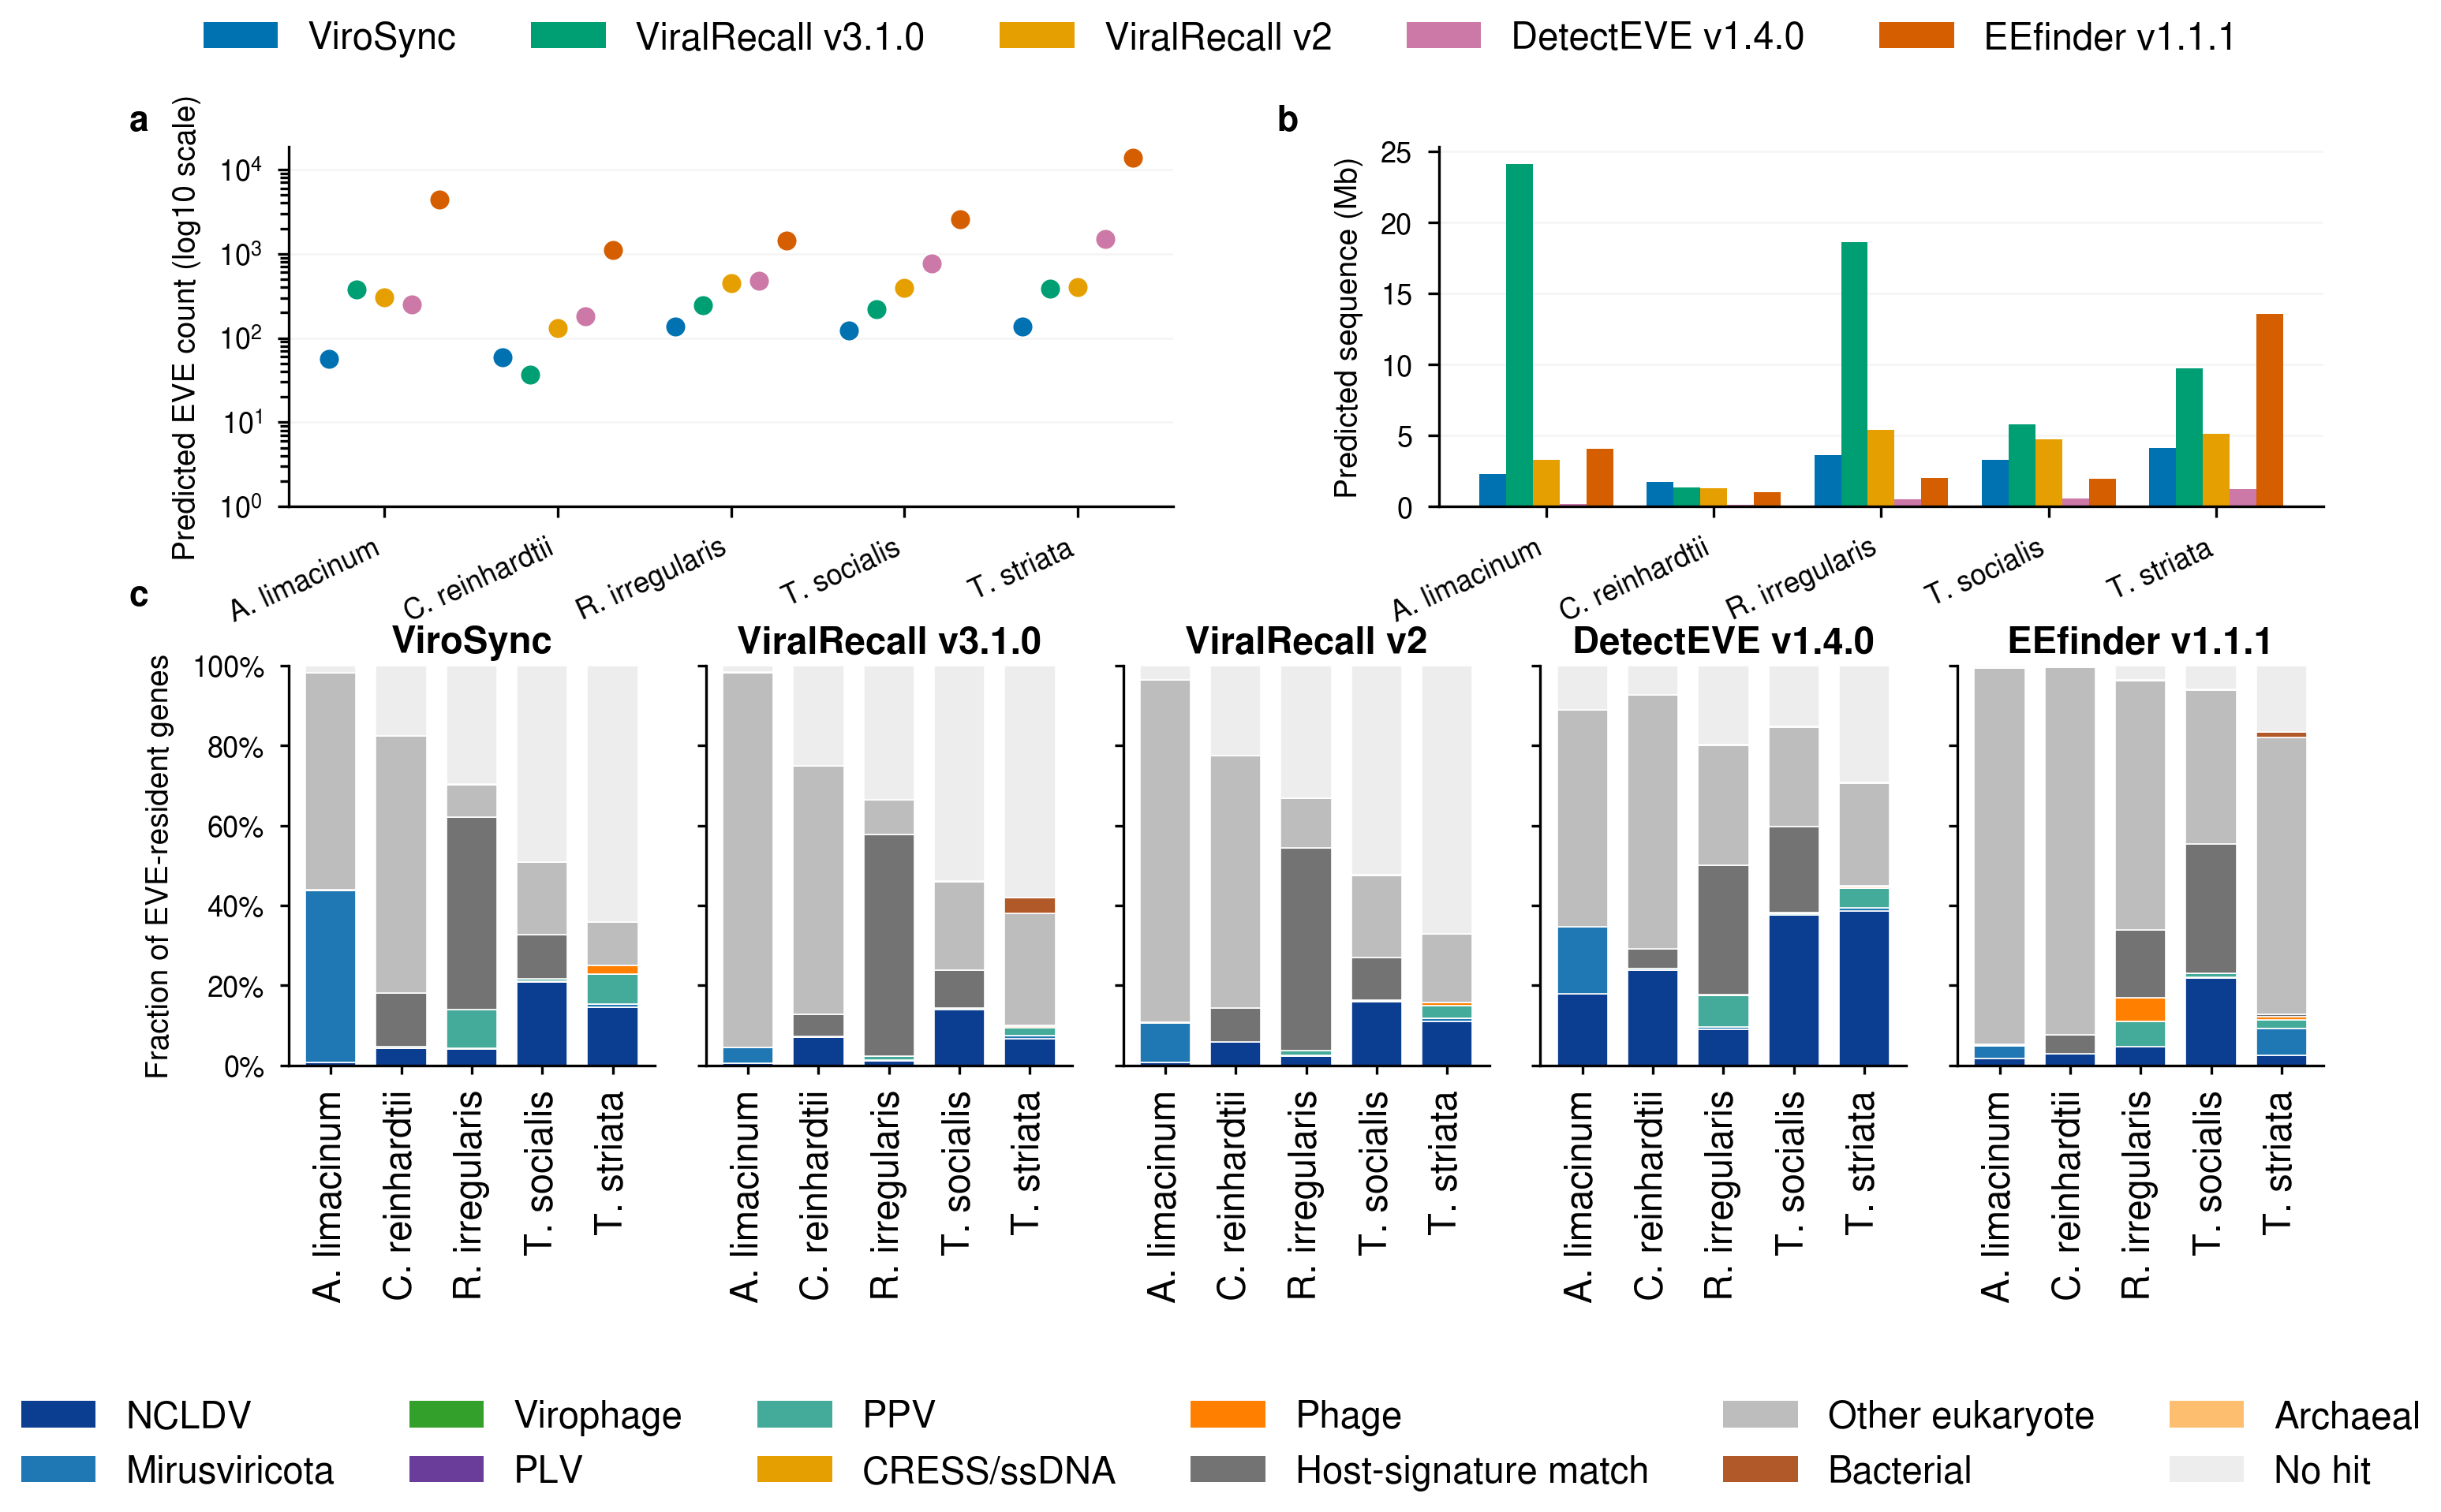
Candidate count, summed region length, and gene composition across five real genomes. DetectEVE and EEfinder emit short homology hits. Their counts measure output granularity and are not direct locus-count comparisons.
See Outputs for the result files and their interpretation.
Paired repeat-annotation regression: October 5–6, 2026
The paired run compared baseline commit 1ceea9d with repeat-evidence commit
8a64514 on 155 frozen inputs. Both source snapshots reported ViroSync 1.0.1 at
the time of testing. Each variant used the same input bytes, runtime,
configuration and development resource bundle v1.1.0. The source content SHA-256
values were:
- Baseline:
35f948433846ade725845b4b4f332b18aa3229186292df852d222c154ac93966. - Repeat evidence:
2df54f21cd8fedb68895a46b54407e1f4adbc96e6e3b570ebf120366d3b2f893.
The resource manifest SHA-256 was
f9fe4d4202e14dd8fe099b2bf06354c7110dd2b43075e1004d2f550303688eb9.
Each run used one worker and 16 threads per input, with two inputs running at
once. Frameshift screening, TMVec2 and InterProScan were disabled. Both variants
started fresh, and source-specific validators checked all 310 completed runs.
All 155 pairs preserved the legacy prediction values, EVE identifiers, endpoints, confidence tiers and sequence exports. The comparison excluded the added repeat-evidence columns and the output/coordinate schema-version fields; 7,493 interval, sequence and gene-taxonomy export files were byte-identical. Both variants accepted 654 EVE rows across the full panel.
| Panel | Inputs | Baseline and repeat-evidence result |
|---|---|---|
| Reported synthetic pool, ds01–30 and ds61–90 | 60 | 54 loci detected at the 500 bp one-to-one overlap threshold; mean best-call recall 0.7767 and Jaccard 0.6261. |
| Prior-discovery panel, ds31–60 | 30 | 30 loci detected; mean best-call recall 0.9142 and Jaccard 0.6809. |
| Survey catalog, ds91–108 | 18 | 22 accepted EVE rows; burden only, excluded from accuracy claims. |
| Selected repeat controls | 42 | Zero accepted calls in two original windows and 40 spiked variants. |
| Real genomes | 5 | 531 accepted EVE rows; burden only, without complete locus truth. |
The reported synthetic pool is separate from the prior-discovery panel. It is semi-synthetic, and its tethysvirus source overlaps references in bundle v1.1.0. The selected repeat controls do not establish genome-wide specificity.
The repeat-evidence variant recorded 1,978 same-orientation pair annotations across 242 detailed candidates, including accepted and rejected candidates. The endpoint statuses preserve incomplete and unassessed searches. These counts describe annotations, not confirmed viral termini or insertion junctions. The panel lacks independent repeat-boundary truth, so it does not measure repeat-boundary sensitivity.
Paired runtime and memory
The sum of per-input wall times was 19,452.28 seconds for the baseline and 19,803.93 seconds with repeat evidence, an increase of 1.8%. These sums are not campaign elapsed times because inputs ran concurrently. Across the 155 pairs, the median modified/baseline wall-time ratio was 0.9994 and the median peak-RSS ratio was 1.0001. For the five real genomes, summed wall time increased from 3,101.33 to 3,486.82 seconds, or 12.4%. Individual real-genome increases ranged from 3.1% to 23.8%, with a median ratio of 1.1064.
Baseline ran first, so the second variant could benefit from warmer input and database caches. Wall time includes Pixi startup. These are single paired observations, not randomized or replicated timing estimates. GNU time peak RSS describes the largest single process, not the concurrent process-tree total.