Runtime and memory by input size
These measurements use the earlier workflow with BLAST's default megablast
search and database v1.0.1. They do not measure the current explicit blastn
search or runtime taxonomy checks.
The benchmark uses nested subsets of the bundled assemblies containing 1, 10, 100, or 1,000 query sequences. Each subset was run through the complete SSUextract workflow with both database profiles.
| Query sequences | Input nucleotides | Accepted loci | Curated wall time | Curated maximum RSS | IMG wall time | IMG maximum RSS |
|---|---|---|---|---|---|---|
| 1 | 113,952 | 1 | 20.63 s | 0.795 GiB | 26.75 s | 0.791 GiB |
| 10 | 771,608 | 2 | 49.82 s | 2.605 GiB | 40.57 s | 2.605 GiB |
| 100 | 3,846,999 | 4 | 104.18 s | 2.723 GiB | 101.25 s | 2.724 GiB |
| 1,000 | 13,254,565 | 10 | 114.69 s | 2.670 GiB | 134.33 s | 2.780 GiB |
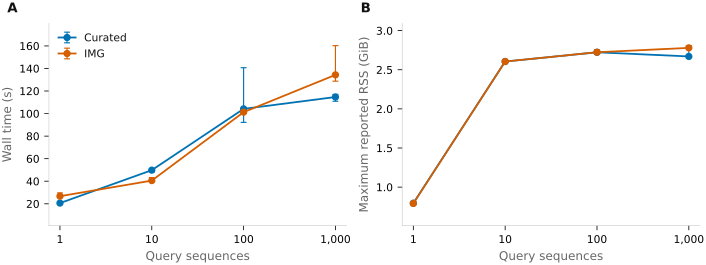
Values in the table are medians from three measured runs. The wall-time error bars show the minimum and maximum measured values.
Benchmark conditions
- One warm-up run preceded the three measured runs for each condition.
- Every run used a fresh Nextflow work directory.
- Search tasks used two threads, with an eight-CPU workflow ceiling.
- The same input subset was used for both database profiles.
- Every run produced at least one accepted locus and identical extracted sequences, summary tables, and BLAST output within its condition.
GNU time wrapped the full pixi run nextflow command. Its maximum RSS is the
largest value reported for that command, not a sum across concurrent workflow
processes. Runtime and memory will vary with sequence length, hit count,
storage, and available CPUs.
The 32 trial records, including warm-ups, input hashes, nucleotide counts, and
accepted-locus counts, are available in
example_performance.tsv. The figure and
summary table are generated by notebooks/example_performance.ipynb.